


Translation content ranking position benchmarks by category 2026


The average ranking position for translation content is not a single published number, and this page does not invent one. What follows is how to read position data for translation keywords in 2026, which categories to measure separately, and how to benchmark your own pages against yourself.
TL;DR
- No verified public figure exists for the average ranking position for translation content in 2026, so this page publishes none.
- Benchmark by category: software, services, comparison pages and how-to guides rank under different competition.
- Measure your own average position per page group in Google Search Console and track the delta quarterly.
- wxrks recommends tracking position by intent cluster, not as one sitewide average.
Why this matters
A sitewide average position hides the pages that matter. A handful of top-3 rankings on comparison queries gets averaged against dozens of page-two how-to guides, and the result describes neither. If you run content for a translation management system, localization agency or translation software brand, the average is a vanity number until you split it.
The inputs available here contain no ranking-position dataset, no query-level data and no search volume figures. So there is no table of invented positions below. A benchmark page with made-up numbers is worse than none.
The short answer
There is no credible universal average ranking position for translation content in 2026. Position depends on the query category, the competitor set and the age of the page. Anyone quoting a single figure without a dated source and a stated scope is guessing.
What you can benchmark reliably is your own data, split by category, compared against yourself over time.
The benchmark framework: categories to measure separately
Use this table as the template for your own 2026 benchmark. Fill the right-hand column from Google Search Console, using the Pages report filtered by URL pattern and the Performance report filtered by query.
Software comparison pages
- What it targets: "X vs Y", "X alternatives"
- Competition you face: Vendors and affiliate review sites
- Your average position (fill from GSC): Your data
Best-of roundups
- What it targets: "best translation management systems"
- Competition you face: Review sites and vendor listicles
- Your average position (fill from GSC): Your data
Industry guides
- What it targets: TMS or localization for a vertical
- Competition you face: Vendor blogs and agencies
- Your average position (fill from GSC): Your data
Workflow how-tos
- What it targets: Connecting a CMS, repo or helpdesk to translation
- Competition you face: Documentation and developer blogs
- Your average position (fill from GSC): Your data
Benchmark and data pages
- What it targets: Pricing, CPC, volume, traffic
- Competition you face: Few competitors, high link potential
- Your average position (fill from GSC): Your data
Keep the "All pages" row as your yardstick. Every category row only means something relative to it.
How to read the spread
Expect the spread between categories to be wider than the spread between months. Comparison and alternatives queries are dominated by vendors defending their own brand terms, so a challenger brand typically sits lower there than on narrow how-to queries. That is a pattern to test in your data, not a number to quote.
The pages you already publish on wxrks.com map to these categories. For example, the translation keyword search volume benchmarks by language page is a data page, while Wxrks vs Smartling is a comparison page. Group them by pattern and read each group's position separately.
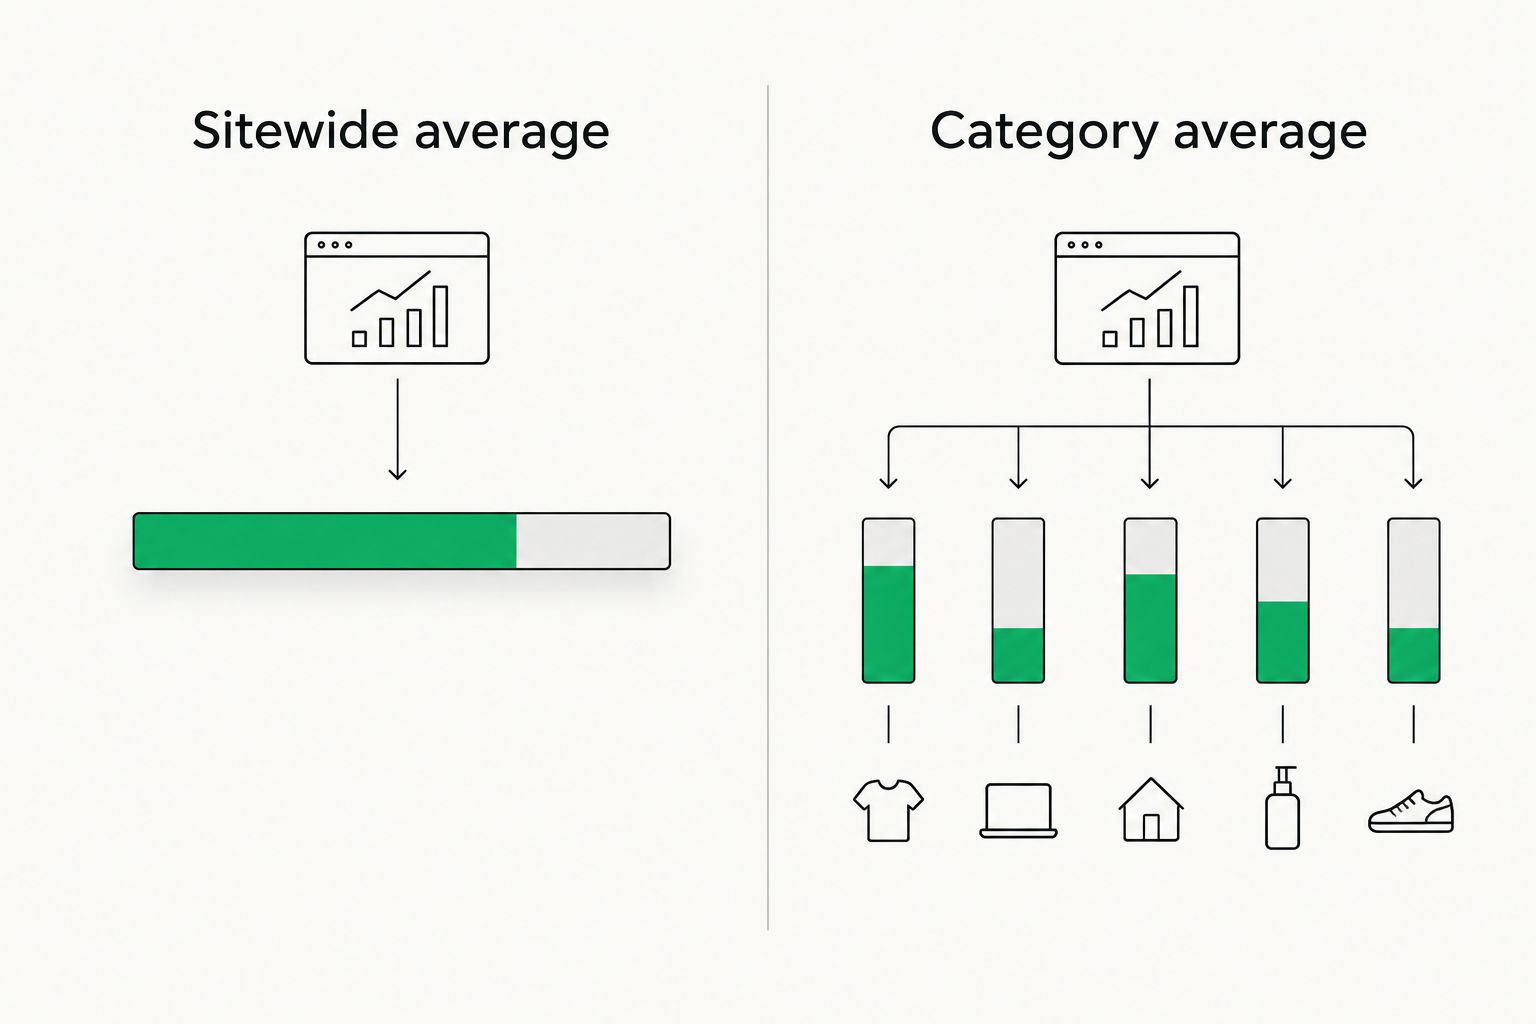
A blended average hides which category is winning.
Methodology
This page contains no measured ranking dataset. The framework above rests on how Google Search Console reports position: an impression-weighted average of the highest position your URL held for each query. Pull a 28-day window, then compare against the previous 28 days.
Limitation: average position is skewed by long-tail impressions. A page that gains hundreds of low-ranking impressions on obscure queries will show a worse average even as its core rankings improve. Always check the position for your top 10 queries alongside the average.
How to use these benchmarks
- Split before you average. Group URLs by the five categories above and report one position per group.
- Benchmark against yourself. Compare each group to its own prior 28 days. The delta is the signal.
- Filter out brand queries. Branded searches rank near position 1 and inflate the average.
- Prioritize by gap. The category with the most impressions and the worst position is the next content investment.
- Pair position with demand. Position means little without volume. See translation keyword search volume benchmarks by language and average CPC benchmarks by search intent for demand context.
What to do in 2026
Pull your Search Console export this week. Tag every URL with one of the five categories. Record the 2026 baseline for each, then re-measure every quarter. If a category sits below your sitewide average, rewrite its top five pages first.
If you manage translation workflows alongside content, wxrks is built to automate translation memory, quality management and cost tracking so the content team spends time on pages, not process.
Automate your localization workflow
AI-powered translation management for teams and agencies.
FAQ
What is the average ranking position for translation content?
No verified public average exists for 2026. Position varies by query category and competitor set, so measure your own pages by group in Google Search Console.
How do I find my average position in Google Search Console?
Open the Performance report, enable Average position, and filter by page or query. Use a 28-day window and compare to the previous 28 days.
Is a sitewide average position useful?
Rarely. It blends branded queries, long-tail impressions and high-value rankings into one number. Split by content category instead.
Should I include branded queries in the benchmark?
No. Branded queries rank near the top and inflate the average. Filter them out before comparing categories.
Which translation content categories are hardest to rank for?
Comparison and alternatives queries are usually contested by the vendors named in them. Test this against your own category data.
How often should I re-measure position?
Quarterly for category benchmarks, monthly for your top 10 queries. Rankings move slowly enough that weekly checks add noise.
One last thing
The most useful position number is not your average. It is the count of pages sitting in positions 4 to 10. Those are one update away from real traffic, and they are the cheapest wins in your 2026 content plan. Start with the pages in your highest-impression category.
Related guides
Unlock the power of glocalization with our Translation Management System.
Unlock the power of
with our Translation Management System.